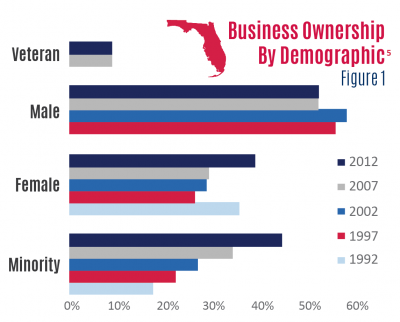
The percentage of minority-owned businesses increased by 36.2 percent between 2007 and 2012, making up 44.1 percent of all Florida businesses (see Figure 1), which proportionately represents more than twice the state’s minority adult population (20.1%). Nationally, the percentage of minority-owned businesses increased by 38.1 percent during the same time period. Minorities represent 28.8 percent of all business owners, meanwhile they represent 21.3 percent of the adult population ages 18 and up.
The number of female-owned businesses [3] has also increased steadily over the past fifteen years. In 1997, female business owners made up only 26.0 percent of business owners; in 2012 they made up 38.5 percent of all business owners in the state. Between 2007 and 2012, female business ownership increased 39.0 percent. The percentage of female-owned businesses in Florida has increased at a similar pace as female ownership nationwide, with 26.0 percent of females owning businesses in 1997 and 35.8 percent in 2012.
Proportionally, female business ownership is still significantly lower than the overall female adult population. Nationwide, females make up 51.3 percent of the adult population ages 18 and up—statewide is at 51.7 percent.
While the percentage of minority and female-owned businesses have increased, there has been little change in the percentage share of male-owned businesses. In 2007 male business owners made up approximately 51.6 percent with little change in 2012 (51.7%). This trend is consistent with male business ownership nationwide which only grew by approximately 2.5 percentage points between 2007 (51.3%) and 2012 (53.7%).
Veteran-owned businesses have also seen little change at both the state and national levels. In Florida, veterans make up 8.8 percent of business owners compared to 9.1 percent nationally. The SBA notes that the veteran population is older than the non-veterans population. [4] As this population continues to retire or pass away one can expect the percentage of veteran-owned businesses will continue to decline.
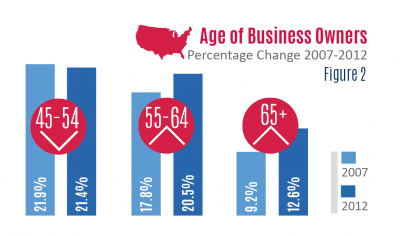
As shown in Figure 2, the SBO also collects data on the age of business owners at the national level. The 45 to 54 age bracket continues to have the largest share of business owners making up 21.9 percent in 2007 and 21.4 percent in 2012; however, the percentage of business owners in older brackets continue to increase. In 2007, business owners ages 55 to 64 made up 17.8 percent compared to 20.5 percent in 2012. Business owners age 65+ made up 9.2 percent in 2007 but increased 3.4 percent to 12.6 percent in 2012.  These statistics are consistent with an aging Baby Boomer population that continues to work beyond retirement. This generation was greatly impacted by the 2007 Great Recession as many companies sought to cut costs through early retirement incentives. At the same time, many lost significant amounts of their retirement savings with little time remaining to make up for losses. Therefore, one explanation for the increase in business ownership is likely due to necessity rather than desire.
[3] The U.S. Census defines ownership by gender as a business where 51% or more of the business is owned by either males or females. Businesses can also be classified as “equally male-/female owned” if ownership is split 50/50 percent.
[4] “Demographic Characteristics of Business Owners,” Small Business Administration, January 16, 2014.
[5] Note: Some data not available for each year.
This article is a series as part of the 2016 State of Small Business Report: Small Business and Its Impact on Florida, a report developed by the Florida SBDC Network in collaboration with the University of West Florida Center for Research and Economic Opportunity. To read the full report, please click here.


